
Table of Contents
Why Fatigue Data Matters More Than Tensile Strength in PM
Many structural PM parts do not fail because a single load exceeded their tensile strength; they fail after thousands or millions of repeated load cycles at stresses well below yield. For rotating or reciprocating components — gears, cams, actuators, pump rotors — the fatigue property is the design property, and tensile data is merely a proxy. This is true for wrought steel too, but PM has a structural reason to take it more seriously: porosity.
In a sintered part, the pores act as internal notches. Each pore is a stress raiser where a fatigue crack can initiate, and the sharpness and location of the largest near-surface pores do more to set fatigue behavior than the average property values suggest. Two consequences follow. First, fatigue strength in PM is considerably more sensitive to density than tensile strength is — small density losses cost a disproportionate amount of fatigue margin. Second, fatigue data scatters more in PM than in wrought steel, so how a number was measured matters more, not less. That is why this page is about reading data, not reciting it: published S-N values are only comparable when the test conditions behind them are comparable.
How to Read PM Fatigue Data
An S-N curve plots applied stress against cycles to failure. For PM materials, the numbers embedded in that sentence hide several traps. Use this table before you compare any two datasets — or any datasheet value against a supplier quote.
| What the Datasheet Says | What to Check Before Trusting It | Why It Matters |
|---|---|---|
| "Fatigue strength" as a single number | The density it was measured at | Fatigue strength moves strongly with density; a value at 7.2 g/cm³ does not describe a 6.8 g/cm³ part |
| A number with no condition stated | As-sintered or heat-treated; surface condition as-pressed or machined | Heat treatment and surface state change fatigue behavior substantially; unstated usually means "best case" |
| Data from test specimens | Whether specimens were machined or tested as-pressed/sintered | Published PM data often comes from machined test bars; as-pressed surfaces behave differently |
| Cycles basis of the "limit" | Whether it cites 10⁷ cycles or another runout | "Fatigue strength" values cite a cycle count; comparing values with different runout bases is comparing different properties |
| Loading ratio | The R-ratio (min/max stress), e.g., fully reversed vs. pulsating | Mean stress shifts the curve; data at one R-ratio cannot be used directly at another |
| A single curve with no scatter band | The survival probability behind the line | Fatigue data is statistical; an average curve and a 90% or 99% survival curve are different engineering quantities |
Two of these deserve a plain-language note, since buyers meet them constantly. The R-ratio describes the loading pattern: fully reversed loading (R = −1, equal tension and compression) is the classic laboratory condition, while a gear tooth sees pulsating loading with a different mean stress. Data measured at one loading pattern cannot be transferred to another without correction. Survival probability describes the statistics: a fatigue curve is really a band, and an "average" curve describes the 50th-percentile part, not the weakest part in your shipment. For safety-relevant designs you want the supplier's basis — average, 90%, 99% survival — stated, not implied.
None of this means PM data is unusable. It means the correct first question to any supplier is not "what is the fatigue strength?" but "under exactly which conditions was that number measured?"
Density Is the Main Lever
If you change only one thing about a PM design to improve fatigue performance, change density. As noted in our material property data, mechanical properties in sintered steels rise with density — and fatigue responds in a stepwise, more-than-proportional way:
- Around 7.0 g/cm³ sits the workhorse range of conventional press-and-sinter structural parts: economical, and fatigue-adequate for lightly loaded components.
- Around 7.2 g/cm³, the additional densification buys a meaningful step in fatigue capability — this is the tier where many fatigue-relevant gears and actuators live.
- Around 7.4 g/cm³ is a common upper target for conventional press-and-sinter on standard tooling; beyond it, the conversation typically changes to routes like double press/double sinter or copper infiltration, with different cost structures.
Each density step costs money — more press capability, tighter powder control, sometimes an extra operation — so the engineering task is matching the density tier to the load case rather than maximizing density reflexively. Specific fatigue values for the grades we produce at each tier are available on request; published values vary with every condition in the table above, and we prefer to state numbers only with their test basis attached. Heat treatment and surface conditioning (for example, shot peening, which introduces compressive residual stress at the surface where PM cracks initiate) shift fatigue capability further — in direction, favorably — but always as modifiers on top of the density decision.
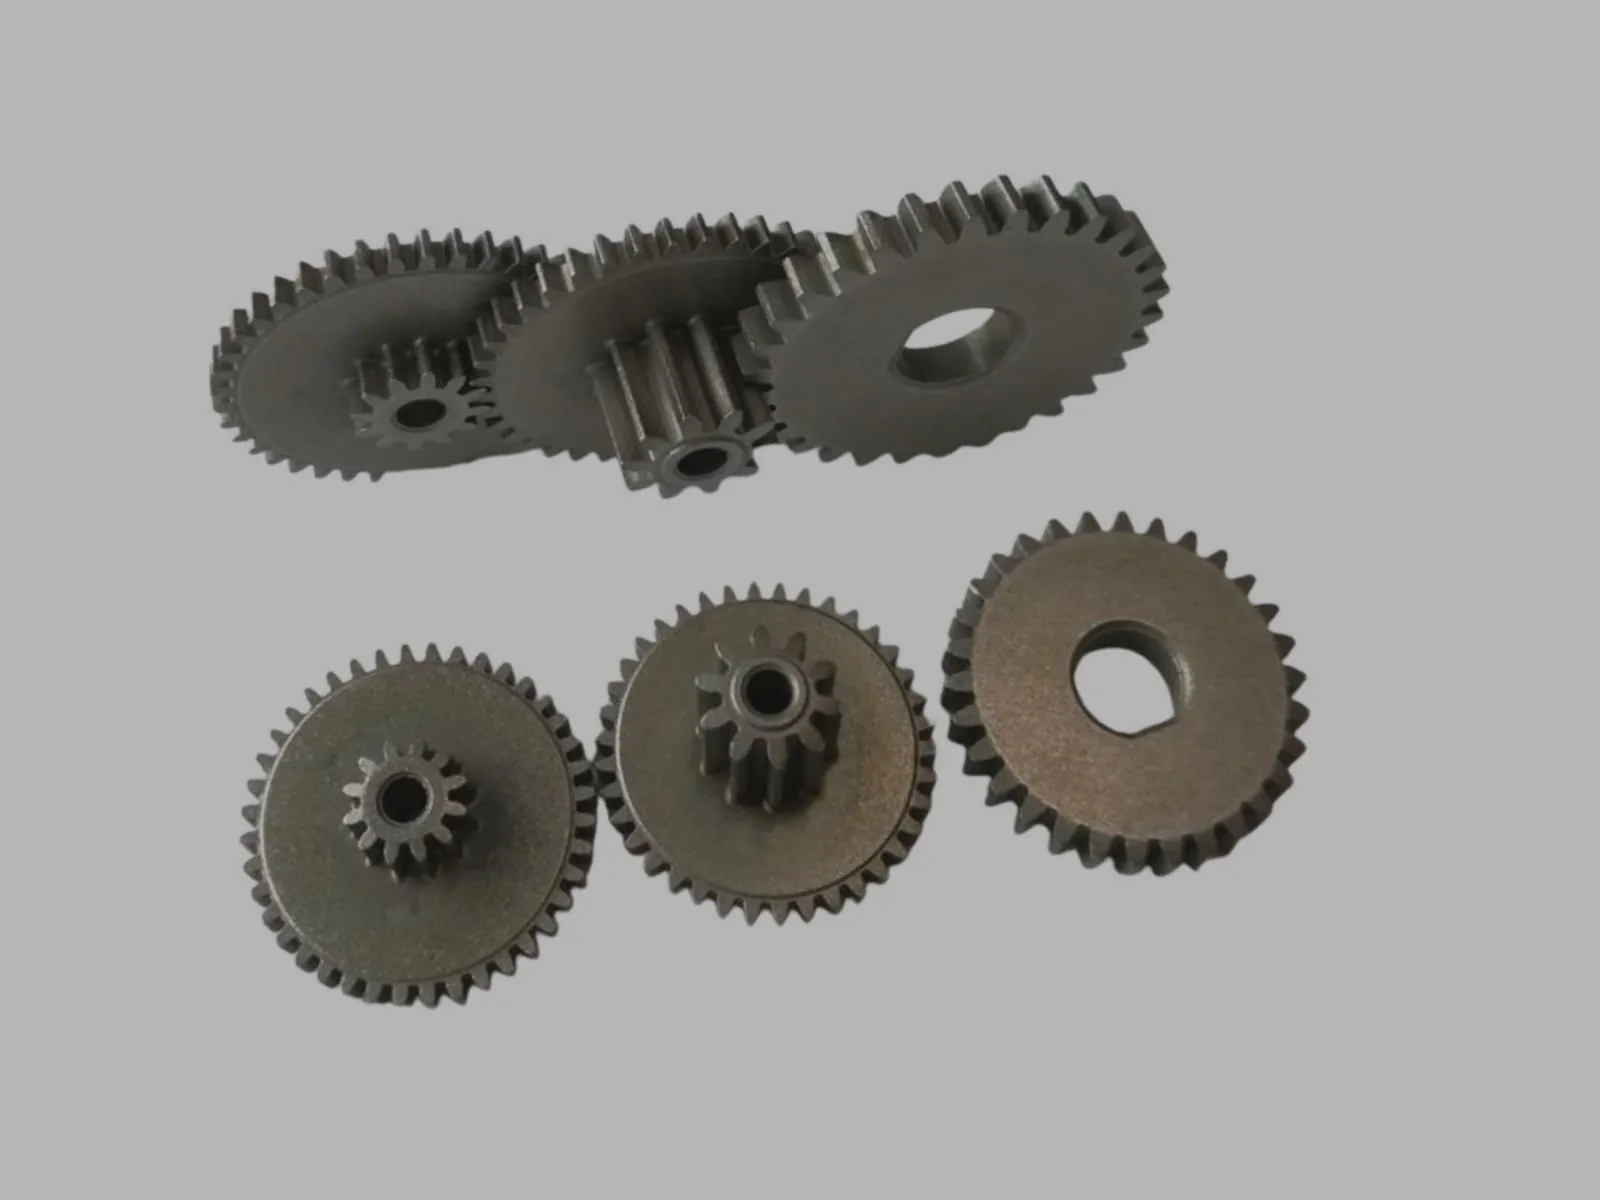
For parts where fatigue and noise both matter, gear accuracy class interacts with load capacity; our discussion of GB9 gear precision covers that coupling from the gearing side.
What to Ask a Supplier for Fatigue-Critical Parts
The right verification path runs from generic data to your specific part, and a supplier who skips steps is asking you to absorb their uncertainty. Ask for:
- Material data with conditions attached. Grade designation, density, condition (as-sintered/heat-treated), specimen type, R-ratio, cycle basis, and survival probability for any fatigue value quoted. A number without this list is marketing.
- Specimens from your powder, processed with your parts. Test bars compacted from the same blend and sintered in the same furnace runs as production — a practical way to close the gap between textbook data and the actual material; not every supplier offers it, so ask.
- Part-level validation for the duty cycle that matters. For genuinely fatigue-critical components, a rig or bench test on real parts under representative loading is the strongest single form of evidence — it captures geometry, surface condition, and porosity distribution as manufactured in the actual part.
Pair those requests with design-stage questions: What density is proposed for the critical sections, and why that tier? Where does the supplier expect crack initiation, and what feature controls it? What surface condition will the as-made part carry? These belong in DFM review before tooling is cut — changing density later usually means new tooling. If you are at that stage, send us the load case with the drawing: we will propose a material and density tier and state which of the three evidence levels above we will stand behind.
A note on scope: this page covers cyclic loading — millions of small loads. For single-event overload, impact, and torsional spikes, see our companion page on impact and torsional strength of PM parts; the mechanisms and the design responses are different, and confusing the two leads to over- or under-specifying.
Frequently Asked Questions
Can I estimate PM fatigue strength from tensile strength?
As a rough screening ratio for a fixed material system and density, practitioners do use empirical relationships — but in PM this shortcut is riskier than in wrought steel, because porosity affects fatigue far more strongly than it affects tensile strength. Use tensile-based estimates only to rank options within one density class, never to set a design allowables across densities. For a design decision, require data measured at your density and condition.
Why do published fatigue values for the same PM grade differ between sources?
Because they were measured under different conditions: density, sintering route, heat treatment, specimen preparation (machined vs. as-sintered surface), R-ratio, runout cycle basis, and survival probability all shift the reported number. Standards-adjacent compilations (such as MPIF Standard 35 data) control many of these variables, but even there, values attach to specific conditions. Any comparison without the conditions listed is not a comparison.
Does heat treatment improve PM fatigue strength?
Directionally, yes — hardening and tempering, and surface treatments that introduce compressive residual stress such as shot peening, typically raise fatigue capability of sintered steels. But heat treatment can also introduce its own risks (distortion, decarburization at surfaces, brittleness if tempering is not right), and the improvement rides on top of the density decision. Treat it as a modifier, not a substitute for choosing the right density tier.
Standards & References
Grade designations and material property data on this page follow published powder metallurgy industry standards. Current editions are available from the publishers:
- MPIF Standard 35 — Materials Standards for PM Structural Parts — Metal Powder Industries Federation (MPIF)
- ASTM International — metal powder and PM material specifications — ASTM International
- ISO 5755 — Sintered metal material: Specifications — ISO
For critical applications, always verify grade data against the current edition of the applicable standard and your part-specific validation requirements.

Expert Review
Yao Qingpu
Powder Metallurgy Manufacturing Expert at SinterWorks PM
Yao Qingpu works with global buyers on powder metallurgy design review, material selection, tolerance planning, cost-down opportunities, and production feasibility. His experience covers PM gears, automotive components, structural parts, and practical DFM support for long-run manufacturing programs.
Related Resources
Use these internal links to keep moving through the most relevant guides, service pages, and technical references for this topic.
FD-0205 Fatigue & Strength Data
The FD-0205 single-grade hub: composition, -95HT ladder, AGMA 6006 routing.
Materials Hub
Grade families, density tiers, and property data.
Powder Metallurgy Gears
The application where PM fatigue questions concentrate.
GB9 Gear Precision
How accuracy class and load capacity interact.
Impact & Torsional Strength
The single-overload companion guide.
DFM Guide
Where density and material decisions get locked in.
Request a Quote
Send the load case with the drawing.